Introduction to R and R Studio
Overview
Teaching: 20 min
Exercises: 10 minQuestions
How do you find your way around RStudio?
How do you interact with R?
Objectives
Describe the purpose and use of each pane in the RStudio IDE
Locate buttons and options in the RStudio IDE
Manage a workspace in an interactive R session
Manage packages
Why should you use R?
What is R and what makes it different from the other software packages out there? R is designed specifically for statistical computing and graphics, and is able to perform any task associated with handling and manipulating data. It is free and open source, the latter meaning that anyone can interrogate the code to see what’s going on – there’s no black box involved. R provides a flexible analysis toolkit where all of the standard statistical techniques are built-in. Not only that, but there is a large R community who regularly contribute new functionality through add-on ‘packages’. In fact, finding a particular statistical model or technique that is not already available through R is a tricky task indeed!
Introduction to RStudio
Basic layout
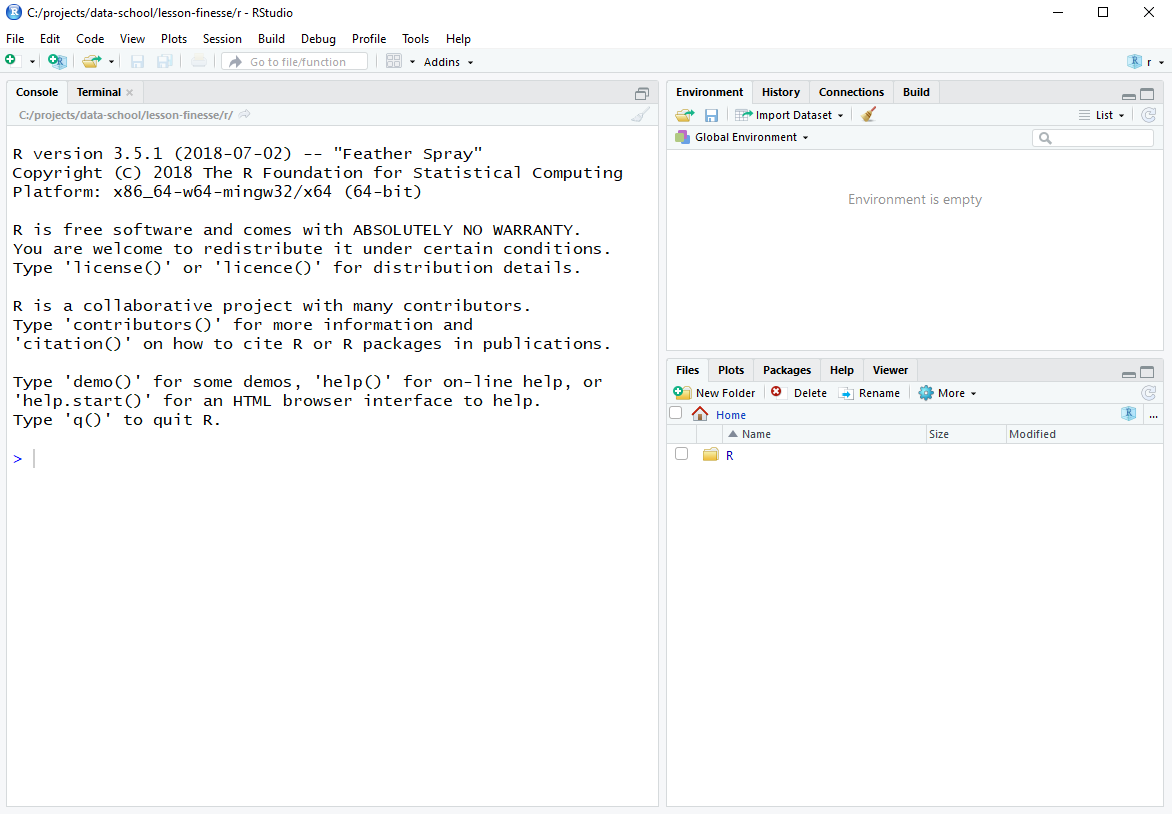
As a reminder, when you first open RStudio, you will be greeted by three panels:
- The interactive R console/terminal (entire left)
- Environment/History (tabbed in upper right)
- Files/Plots/Packages/Help/Viewer (tabbed in lower right)
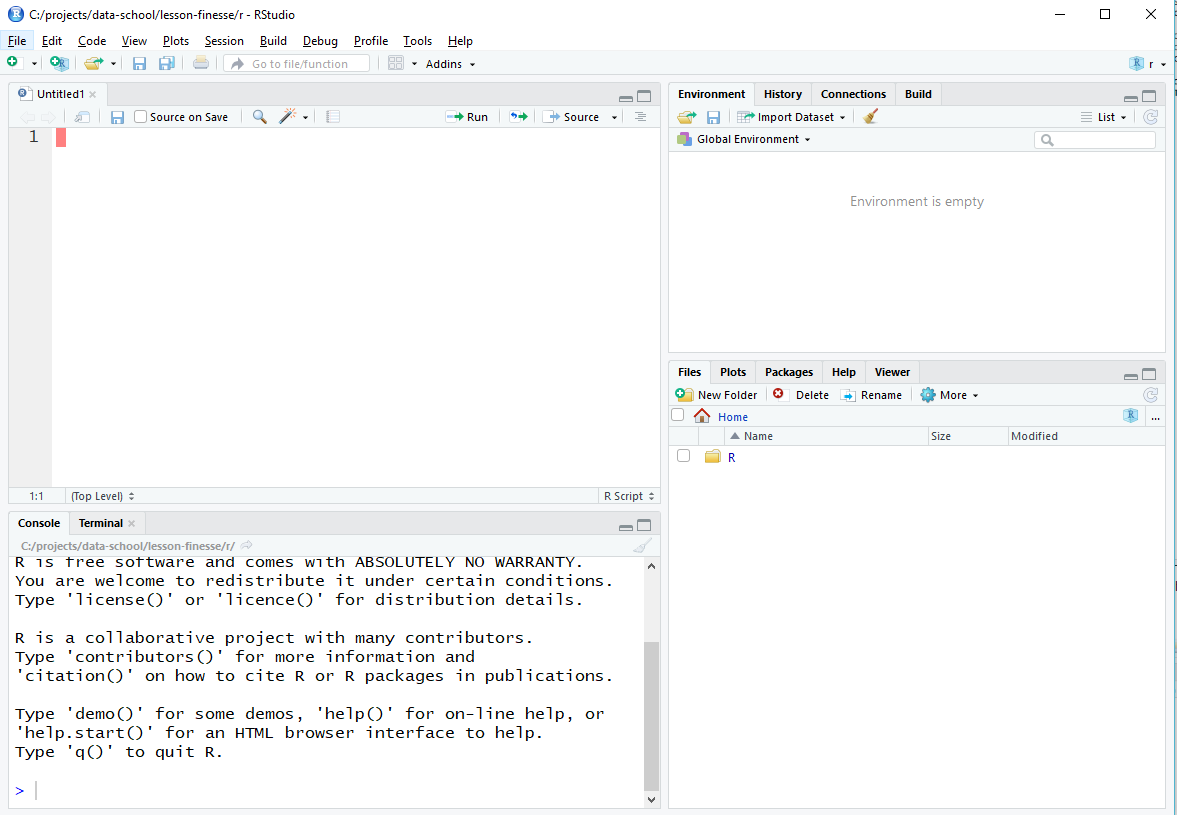
Once you open files, such as R scripts, an editor panel will also open in the top left.
You can move the panels around in RStudio so that their arrangement suits you.
Work flow within RStudio
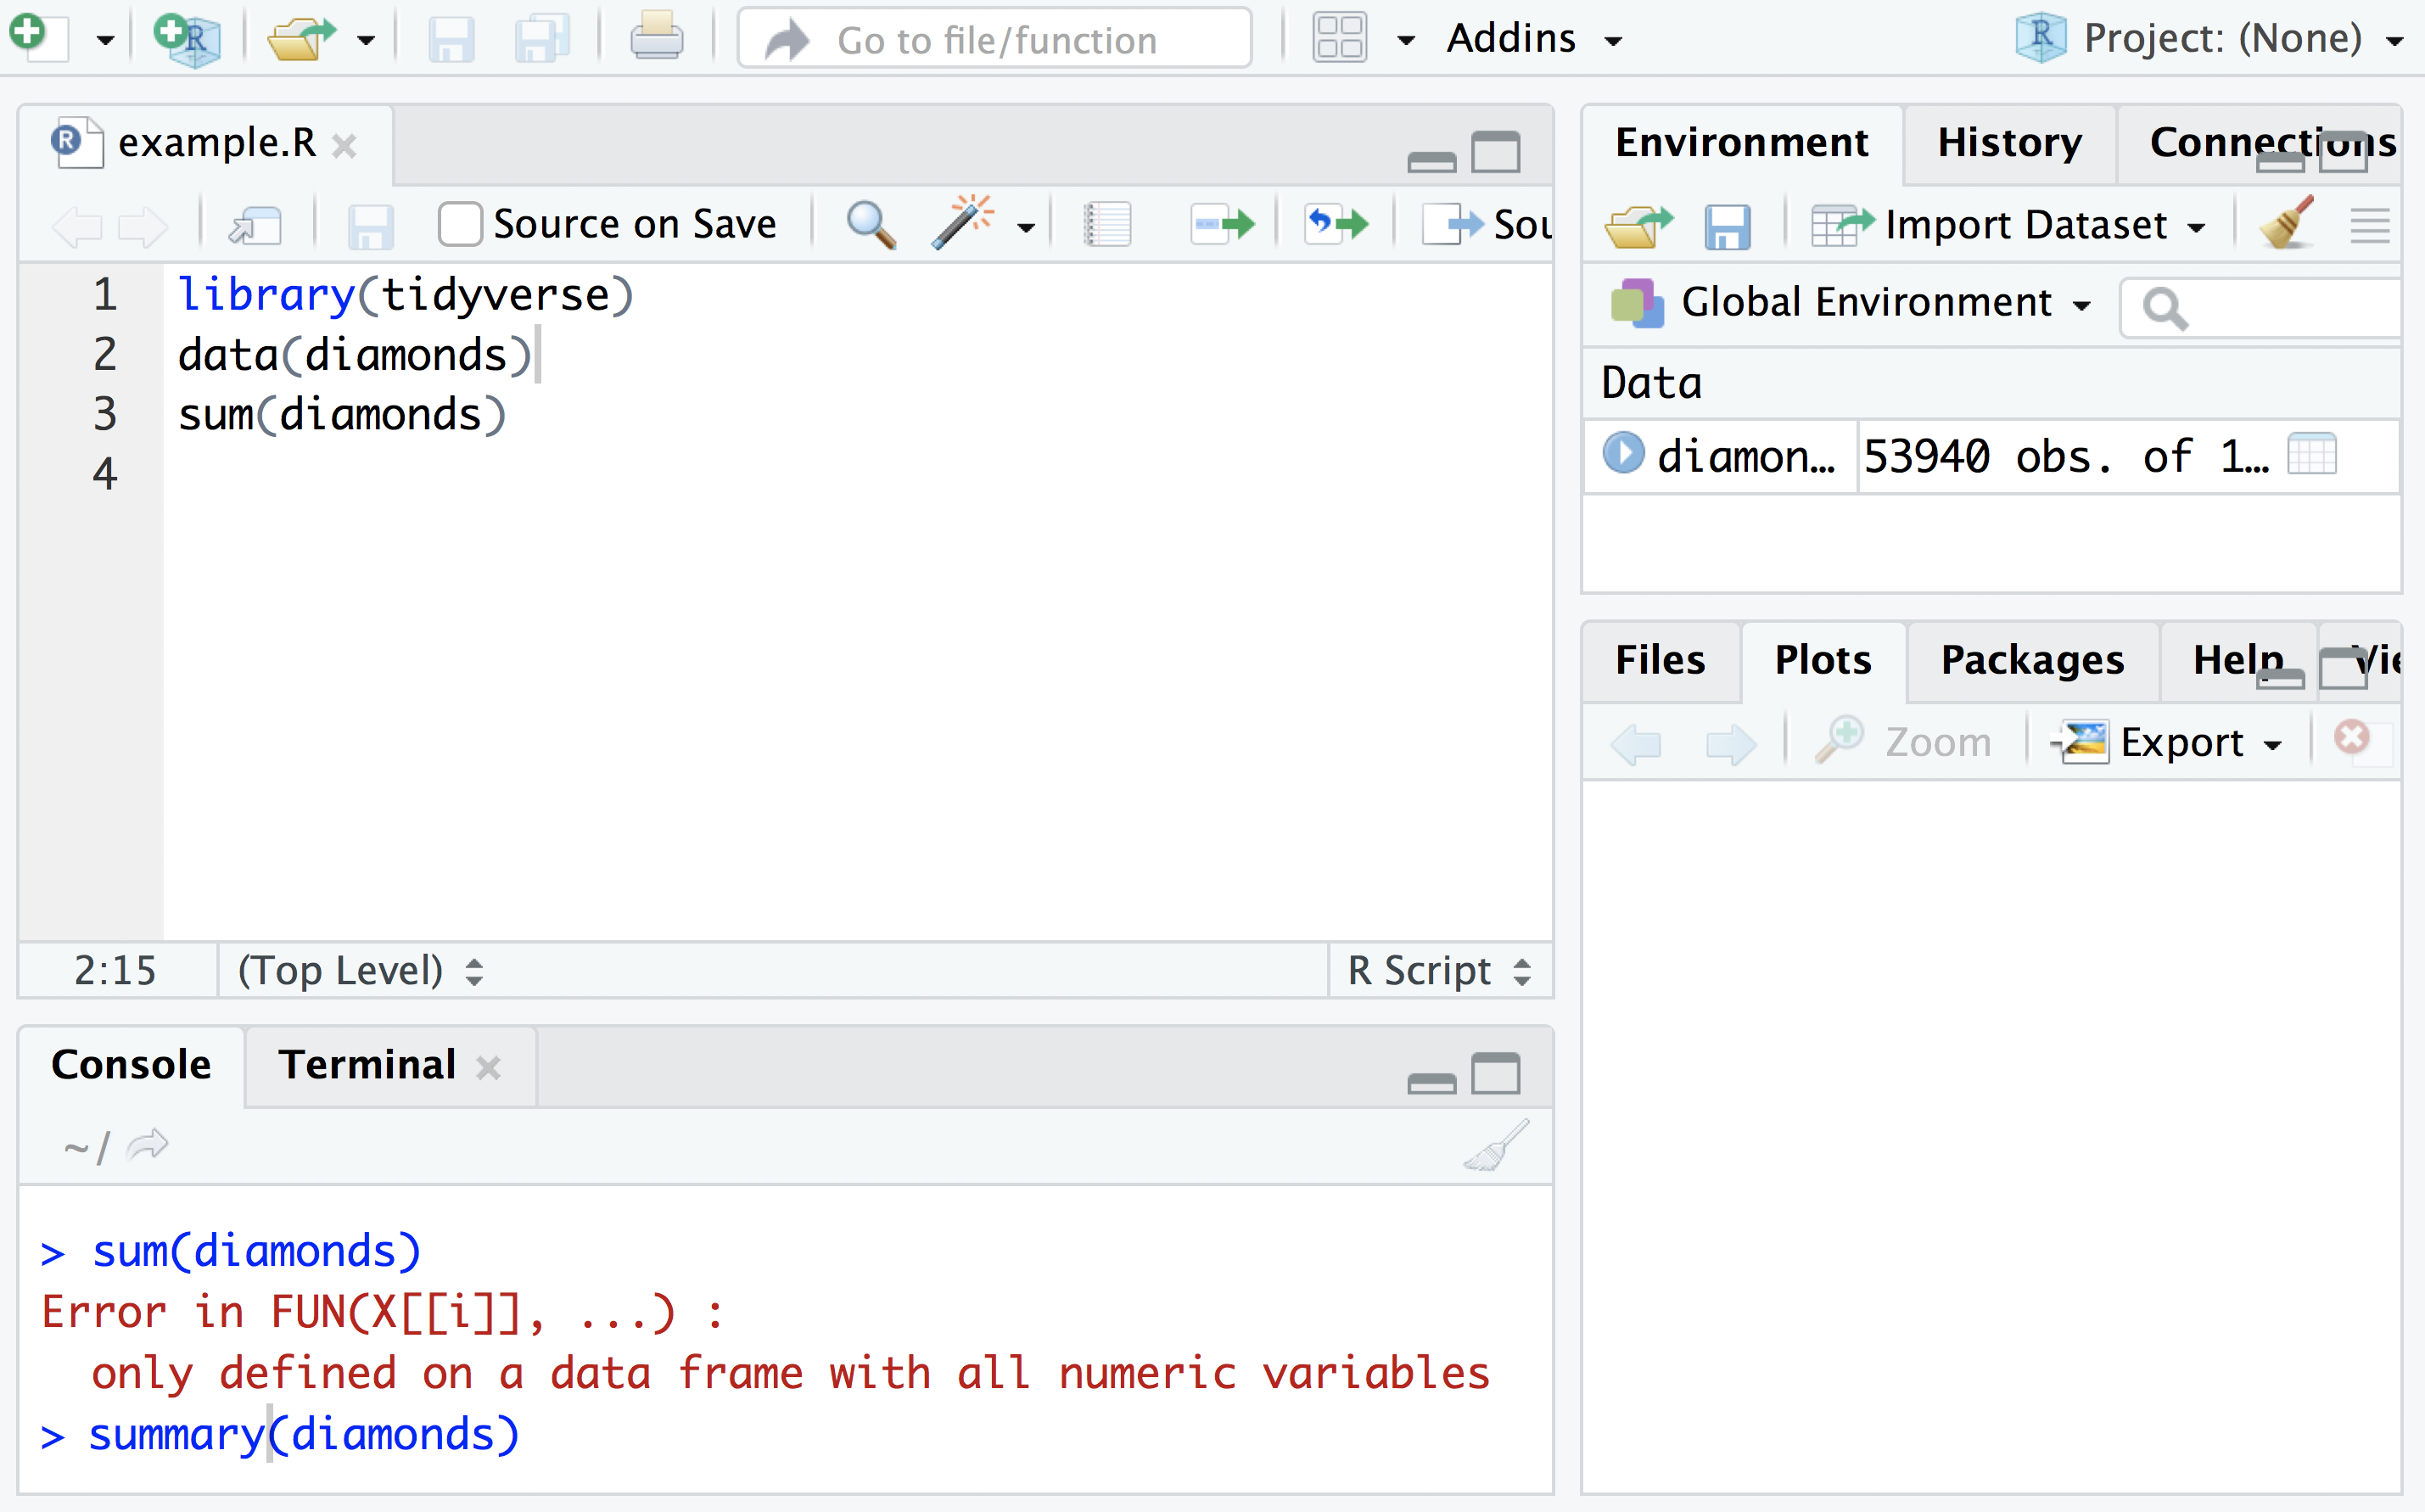
The best way to work with R is to write your commands inside .R files.
- Open and save a new .R file
- Write some lines of code.
- Use RStudio’s short cut keys for the Run command to push the current line, selected lines, or modified lines ot the interactive R console.
- You can rerun commands from the interactive console by using ↑. This is useful for debugging.
Using this approach:
- All your code is saved for later
- You will be able to run the file you create from within RStudio
or using R’s
source()function.
Discussion: the interactive console
You can also type commands directly into the interactive console. When might this be appropriate? What are the advantages / disadvantages?
Tip: Running segments of your code
RStudio offers you great flexibility in running code from within the editor window. There are buttons, menu choices, and keyboard shortcuts. To run the current line, you can 1. click on the
Runbutton above the editor panel, or 2. select “Run Lines” from the “Code” menu, or 3. hit Ctrl+Return in Windows or Linux or ⌘+Return on OS X. (This shortcut can also be seen by hovering the mouse over the button). To run a block of code, select it and thenRun. If you have modified a line of code within a block of code you have just run, there is no need to reselct the section andRun, you can use the next button along,Re-run the previous region. This will run the previous code block including the modifications you have made.
Projects
R Studio provides in-built support for keeping all files associated with a project together. This includes the input data, R Scripts, analytical results and figures.
A good project layout will ultimately make your life easier:
- It will help ensure the integrity of your data;
- It makes it simpler to share your code with someone else (a lab-mate, collaborator, or supervisor);
- It allows you to easily upload your code with your manuscript submission;
- It makes it easier to pick the project back up after a break.
Challenge: Creating a self-contained project
We’re going to create a new project in RStudio:
- Click the “File” menu button, then “New Project”.
- Click “New Directory”.
- Click “Empty Project”.
- Type in the name of the directory to store your project, e.g. “intro-to-r”.
- Click the “Create Project” button.
Now when we start R in this project directory, or open this project with RStudio, all of our work on this project will be entirely self-contained in this directory.
Best practices for project organisation
Although there is no “best” way to lay out a project, there are some general principles to adhere to that will make project management easier:
Treat raw data as read only
This is probably the most important goal of setting up a project. Data is typically time consuming and/or expensive to collect. Working with data interactively (e.g., in Excel) where it can be modified means you are never sure of where the data came from, or how it has been modified since collection. It is therefore a good idea to treat your raw data as “read-only”.
Data Cleaning
In many cases your data will be “dirty”: it will need significant processing to get into a useful format. This task is sometimes called “data munging”. It is a good idea to have particular scripts just for the munging process.
Treat generated output as disposable
Anything generated by your scripts should be treated as disposable: it should all be able to be regenerated from your scripts.
Tip: Good Enough Practices for Scientific Computing
Good Enough Practices for Scientific Computing gives the following recommendations for project organisation:
- Put each project in its own directory, which is named after the project.
- Put text documents associated with the project in the
docdirectory.- Put raw data and metadata in the
datadirectory, and files generated during cleanup and analysis in aresultsdirectory.- Put source for the project’s scripts and programs in the
srcdirectory, and programs brought in from elsewhere or compiled locally in thebindirectory.- Name all files to reflect their content or function.
Save the data in the data directory
Now we have a good directory structure we will now place/save the data file in the data/ directory.
Challenge 1
Download the gapminder data from here.
- Download the file (right mouse click -> “Save as”)
- Make sure it’s saved under the name
gapminder.csv- Save the file in the
data/folder within your project.We will load and inspect these data later.
Key Points
Use RStudio to write and run R programs.
Set up an RStudio project for each analysis you are performing.