Quick and easy interactivity
Overview
Teaching: 45 min
Exercises: 30 minQuestions
How do I use Shiny in R Markdown documents?
How can I share Shiny apps?
Objectives
To create interactive documents
To understand how to host interactive applications
You may have realised in the previous introduction to Shiny that an interactive application can quickly become a complex beast. if you wish to take your Shiny understanding further there are written and video tutorials available that take you through the basics in a more detailed way.
For now however, we can discuss a few options for getting the most out of interactivity without having to go deeper down the rabbit hole.
Interactive documents
It is possible to use Shiny components in an R Markdown document to add elements of interactivity to your reports. This reduces a lot of the complexity of a Shiny app because the R Markdown document handles most of the UI elements for you, leaving you to focus on the connecting the reactive elements.
In order to create an interactive R Markdown document, you need to add the following to the header block:
-----
runtime: shiny
-----
This will turn your document from a static to an interactive version. Since this interactive version
is now a Shiny app, you must be rendering to an HTML output such as html_document.
To add input components to the document, you place them where you want them to appear with
the ____Input() functions, exactly as with a regular Shiny app. The values of these inputs are
accessed through the input object as before too.
To add a reactive output, you place them directly by using one of the render____() functions. Within
the render function you can refer to any of the input values from the entire document. There is no
need to save the result into the output object, or create a UI output. These are managed for you
automatically.
As a demonstration, creating the example app in R Markdown would look something like this:
---
output: html_document
runtime: shiny
---

```{r}
sliderInput("bins", "Number of bins:", min = 1, max = 50, value = 30)

renderPlot({
        x    <- faithful[, 2]
        bins <- seq(min(x), max(x), length.out = input$bins + 1)

        hist(x, breaks = bins, col = 'darkgray', border = 'white')
    })
```
Interactive R Markdown documents will never be as fully featured or customisable as a normal Shiny app. But they do provide an option to enhance your documents with small elements of interactivity without requiring the whole infrastructure of a complete app.
Interactive plots
Alternatively, you may not be interested in a complete interactive application. Just in a single plot that a user can explore on their own. While there are some possibilities for direct interaction with plots produced in R using Shiny, there are also packages that allow you to make use of JavaScript visualisation libraries to make truly interactive plots from within R.
The easiest of these to get started with is probably the plotly package which uses the plot.ly
library. This has a ggplotly() function which takes a ggplot object and converts it into an
interactive HTML plot.
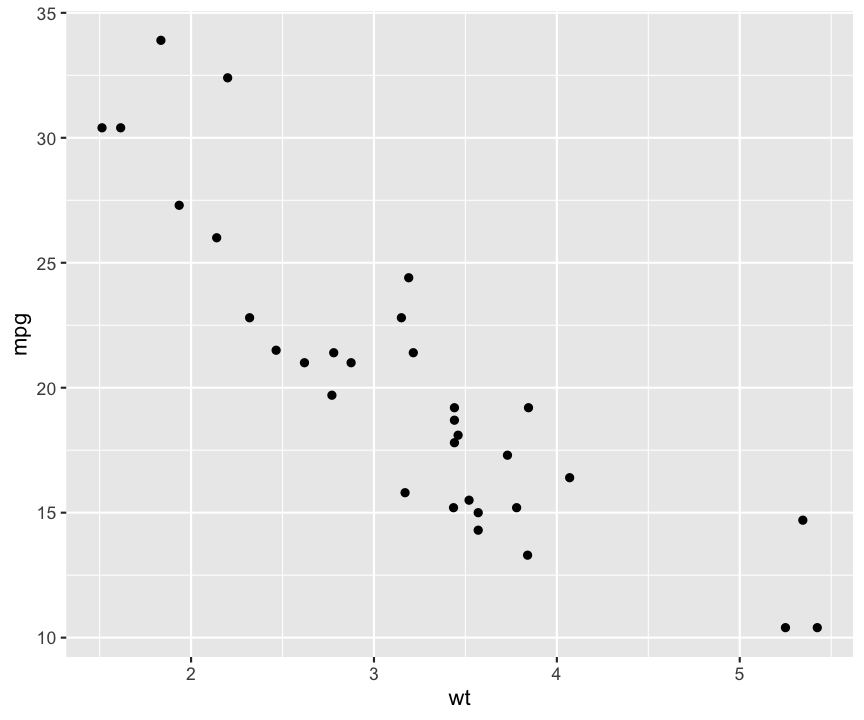
cars <- mtcars %>%
  rownames_to_column("car_name") %>%
  mutate(cyl = as.factor(cyl))

car_plot <- ggplot(cars, aes(x = wt, y = mpg)) +
  geom_point()

car_plot

ggplotly(car_plot)
By default, plotly will include any mapped aesthetic value in the tooltip for each point:
colourful_plot <- ggplot(cars, aes(x = wt, y = mpg, colour = cyl)) +
  geom_point()

ggplotly(colourful_plot)
But the tooltip can be provided directly using the text aesthetic in your plotting code (which has
no function in a regular ggplot plot) and the tooltip argument of ggplotly().
tooltip_plot <- ggplot(cars, aes(x = wt, y = mpg, colour = cyl, text = car_name)) +
  geom_point()

ggplotly(tooltip_plot, tooltip = "text")
These interactive visualisations can be standalone or created as part of an R Markdown document
without needing a complete Shiny app behind them. Or you can integrate them into a Shiny app by
using the plotlyOutput()/renderPlotly() functions from the plotly package.
Sharing your creations
Running your Shiny application requires an active connection to an R session to run your server code. This is not an issue when developing your app, because your computer acts as the server. It can pose some difficulties when sharing your app however.
Your options for sharing essentially fall into two categories
Your user runs it
You rely on your end users to run the code on their own computer that has R and all the necesssary packages installed.
This might involve emailing them the files for the app, or putting it somewhere else in an accessible
place. If you are using GitHub for version control, the most recent version of your app can be downloaded
and run by using the runGitHub() function. Try runGitHub("rstudio/shiny_example") for an example
of this in action.
Find a server to run it
You install your app on a web server that has R and all the necessary packages installed. That server is responsible for running your app when a user visits the site.
There are a few options for how this can work. RStudio has a service at shinyapps.io that lets you upload apps directly from within RStudio. Many instutions will have their own Shiny servers that can be used. Or if you are feeling adventurous you can even try doing it yourself.
Key Points
runtime: shinyin the R Markdown header will enable usingshinycomponentsYou do not need to worry about the ui.r file in this case
You need a computer running R as the server to share Shiny apps