Interactivity with Shiny
Overview
Teaching: 60 min
Exercises: 60 minQuestions
How can I create interactive visualisations?
Objectives
To explain the idea of reactivity in Shiny
To trace a reactive path through a basic app
To create an interactive app using multiple inputs and outputs
Creating interactive web applications provides an alternative way of presenting your data. Rather than providing a single, predetermined summary of your data, you can instead provide the tools for your end users to investigate your data in their own way.
The basic tools for producing these apps can be found in the Shiny package. These apps can be extended with a little bit of HTML, CSS or JavaScript, but you can create a fully functional app using only R code.
Reactivity in Shiny
Creating these interactive applications will involve a pretty large conceptual shift however, because it ‘breaks’ the way we have learned R behaves.
Standard behaviour
Consider the following lines of code:
a <- 10
b <- a + 5

b

a <- 20

b
What is the value of
beach time it is printed?Solution
bis 15 both times.
In a traditional environment, when R creates a variable from an expression it determines the value of
that variable at the time of assignment and stores it. Once stored, the variable loses any connection
to the values were used to create it. So in the example above, once the value of b has been set the
value of a can be changed without any effect on b.
The Shiny framework provides a reactive environment, in which inputs and outputs can be linked together, allowing them to all update in response to changes. Conceptually, the above example running in a reactive environment would result in:
a <- 10
b <- a + 5

b
[1] 15
a <- 20

b
[1] 25
The variable b now updates its value in response to changes in a. Shiny handles the process of
creating this interactivity in the background, and you can read more about it
here. From our perspective however,
changes to one value in our code will appear to flow on to other parts of code that depend on them.
The one limitation that Shiny imposes on our code is that any elements you create within a reactive environment cannot be accessed by elements in the traditional environment. Since the value of a reactive element is not fixed, it is impossible for traditional evaluation to occur. The opposite is not true however, reactive elements can access other reactive elements as well as those in the traditional environment.
An app in two halves
When writing a Shiny app, your code will be broken up into two separate parts.
User Interface
The first is the user interface (UI) of the app. This contains all of the inputs that your end user will be able to control, and the outputs that they will see. The final result of your UI code is a single HTML page that can be opened in a web browser.
Server
The second is the server logic of the app. This is what will run your code in response to user input, and create the outputs to provide to the user. This part of the code requires an active R session to function properly, which means you need to find a way to host your app if you want to make it accessible to other people.
Creating an app
Shiny comes with a number of inbuilt example applications that can be run from the R console. We’ll explore one of these before we start diving in to creating your own
The end product
The first example app can be run with:
library(shiny)
runExample("01_hello")
Explore this basic example and list the reactive, and non-reactive elements you can find. Can you further classify the reactive elements as inputs or outputs?
You have been interacting with the UI half of the example application. What do you think is happening in the server half?
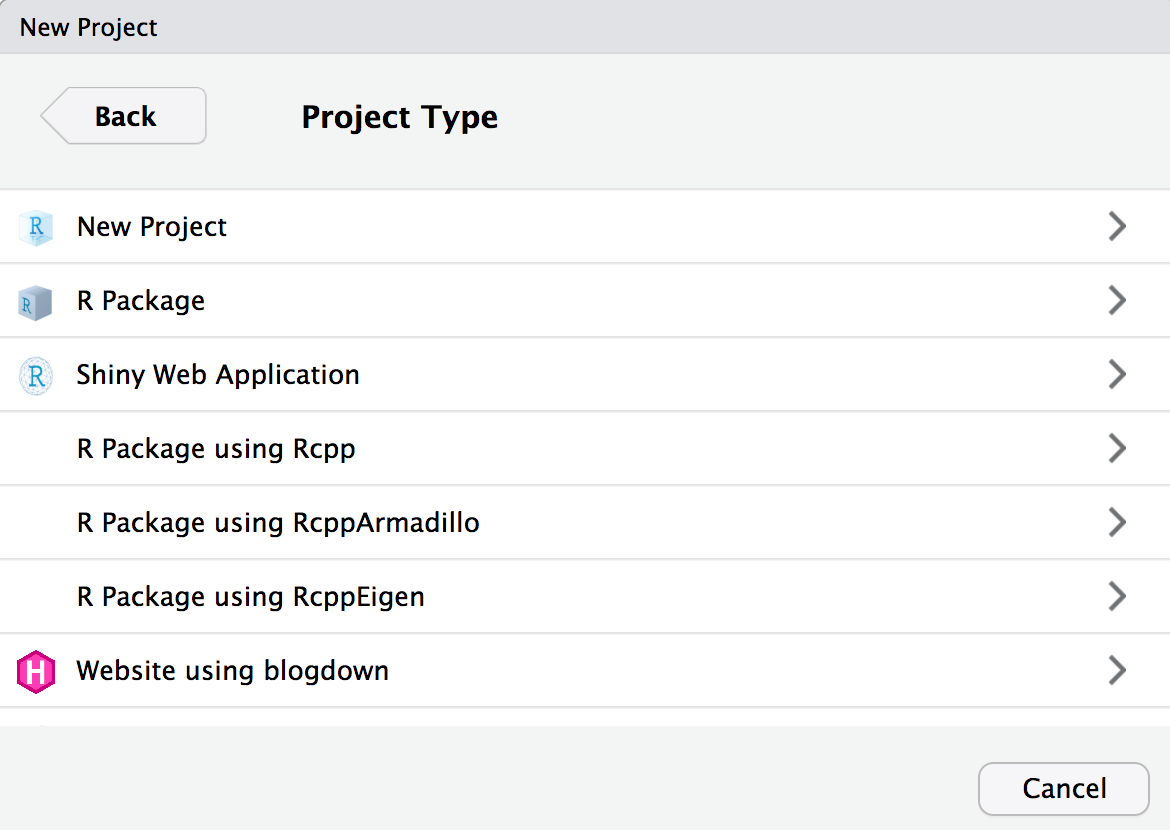
Creating a Shiny app of your own can be done within RStudio by creating a new Project in a fresh
directory. At the Project Type window, select Shiny Web Application.
This creates a skeleton application with the code from the example we just looked at. To run this
app again, click the Run App button in the top corner of the code editor pane 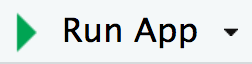 .
.
Exploring an app
Run the default app created when you set up the project and confirm that it has the same function as the example app run previously.
Look through the the code of the app to identify:
- The UI and the server code
- The UI inputs and outputs you identified in the previous exercise
- How those inputs and outputs are referred to in the server
Hint: Searching the file (Ctrl+F) for ‘input’ and ‘output’ will help with the last two parts if you are stuck.
Solution
- UI: lines 13–33, Server: lines 36–46
- Number of bins input slider: lines 21–25, Plot output: line 30
- Input slider: line 41 (
input$bins), Output plot: lines 38–45 (output$distPlot)
The functions used in the UI part of the code, just produce the HTML code that makes up the web application. You can see this for yourself by running some of these functions at the R console. For example:
titlePanel("Old Faithful Geyser Data")
<h2>Old Faithful Geyser Data</h2>
or
plotOutput("distPlot")
<div id="distPlot" class="shiny-plot-output" style="width: 100% ; height: 400px"></div>
Within the server code, you will mostly see R expressions like you are used to. Two variables are
created (x and bins) and then a histogram is produced with hist().
Changing things around (optional)
There are some small differences between the example app you ran initially and your current code. To properly recreate the example edit your code to:
- Change the title of the page to “Hello Shiny!”
- Change the colour of the histogram from
"darkgrey"to"#75AADB"- Add a title to the histogram reading “Histogram of waiting times” (
mainargument ofhist()function)- Add a label to the x axis of the histogram reading “Waiting time to next eruption (in mins)” (
xlabargument ofhist()function)
Talking together
The UI and server in an app communicate using the input and output objects seen in the server code
of the example app. The slider in the UI code is set up with the ID bins (sliderInput("bins", ...))
and then the value of the slider is able to be accessed in the server by using input$bins.
Similarly, the histogram that is created is saved as output$distPlot. The ID this is saved under
(distPlot) is then referenced in the UI when creating a place to display the histogram
(plotOutput("distPlot")).
You might notice that there is no explicit connection made between the input and the output in this
code. Instead, there is an implicit connection because the output plot uses the input$bins value
in creating the histogram. Shiny keeps track of these ‘dependencies’ (the histogram plot is dependent
on the input$bins value), and reruns code if the dependencies have changed.
So when the slider is moved, the value of input$bins changes. Shiny knows that the output$distPlot
is dependent on the input$bins value and asks the code that produces the histogram to run again.
While running again the new input$bins value is used, creating a different histogram.
Inputs
So far, we have looked at a single type of input - a slider that changes a single numerical value. In
the UI code, this slider is created with the sliderInput() function:
sliderInput("bins",
  "Number of bins:",
  min = 1,
  max = 50,
  value = 30)
The first argument ("bins") is the ID that will be associated with the slider. This ID is how we can
access the value of this slider in our code (through input$bins) and so must be unique within your app.
The other arguments determine the label of the slider (the text that is displayed in the UI describing
what the slider controls) as well as the minimum and maximum values it can take. The value argument
determines what the initial value of the slider will be when the app is started.
This same basic structure is used for all the input elements you can create. There will be an input
creation function used in the UI of the form _____Input("ID", ...) and the value of that input is
accessible in the server code with input$ID. Along with sliders you can create:
- Checkboxes with
checkboxInput() - Selections from multiple options with
selectInput() - Text entry with
textInput() - Numeric input with
numericInput() - File uploads with
fileInput()
and other possibilities that you can see in the Shiny input gallery.
Some of these input options are just different ways of getting the same result. Try substituting
the sliderInput in your code for numericInput for example. The app should still run the same,
but the way that the number of histogram bins are selected will have changed.
Taking input
Starting with a minimal Shiny application:
library(shiny)
ui <- fluidPage(

)
server <- function(input, output) {

}
shinyApp(ui = ui, server = server)
Create four different input types in your UI; a slider (
sliderInput()), a selection box (selectInput) containing at least three options, a numeric field (numericInput), and a free text entry field (textInput).Run your app to check that they are all displaying properly. How would you refer to the values of these inputs in your server code?
Outputs
To create outputs we will need three components. Like the inputs, there will need to be a UI element
created to display the output. These output elements use the form _____Output("ID"), such as in the
example where the UI element to display the histogram is created with plotOutput("distPlot"). The
"ID" tells Shiny where the server code will be creating the output (output$ID), and so again it
must be unique among output IDs in your app.
The final part of creating an output is to ensure that the output is being produced in a reactive
environment. Remember that only reactive elements can access other reactive elements. The input and
output objects Shiny creates are reactive, so without this step our plot would not be able to read
the input$bins value from the slider.
Making the output reactive is done by wrapping the histogram plotting code in the renderPlot() function.
Each render____() function works with a corresponding output type in the UI. So the renderPlot()
function creates an outut that can be used in a plotOutput(). The renderPlot() function takes the
code to produce a plot as it’s first argument and it runs that code in a reactive environment. If
multiple lines of code are needed to produce the plot, they can be wrapped in {} to run together.
In the example, this overall structure looked like:
output$distPlot <- renderPlot({
  # Plotting code goes here
})
There are different output types you may be interested in creating. The most common ones you are likely to need are:
- Showing plots:
renderPlot()/plotOutput() - Showing data in a table:
renderTable()/tableOutput() - Showing just text values:
renderText()/textOutput()
Other possibilities can be found by searching the Shiny help files with ??shiny::render
Giving feedback
To get comfortable with the idea of creating outputs that respond to user input, we will begin by repeating back the values provided by the inputs in the previous exercise.
Pick one input to work with initially and:
- Determine what output type is most appropriate and create a place to display the output in the UI with
____Output("inputA").- Create the output in the server with
output$inputA- Save the value of the input into
output$inputA. Don’t forget to wrap it in the appropriaterender____()function.Repeat this process for the other three inputs so that your app will now display the value of each of them.
Solution
A minimal example for a slider input:
library(shiny)
ui <- fluidPage(
    sliderInput("slider_number", "A slider value:", min = 1, max = 10, value = 5),
    textOutput("slider_value")
)
server <- function(input, output) {
    output$slider_value <- renderText({ input$slider_number })
}
shinyApp(ui = ui, server = server)
It might seem odd to just be repeating the input values back as outputs, but printing these values out to the screen is a technique you may find useful when solving errors in your app.
More useful outputs
Let’s start to produce outputs that are more interesting than telling us the input values. We will create a plot of GDP per capita and life expectancy from the gapminder data where the user can select the year that is plotted.
The steps you will need to add to your code are:
- Read in the gapminder data
- Create an input in the UI that can select the year to plot (try a
selectInput())- Create an output in the UI that will display the plot
- Create the output object in the server that will contain the plot
- Filter the gapminder data by year based on the input value and create a plot
- Wrap the filtering and plotting code in a
renderPlot()function and assign it to the output object
Generic reactives
Sometimes, you will need an intermediate step that is neither an input or output, but is still reactive. This might be because you want to reduce duplication in code, or because you have a time consuming step that you need to run and don’t want to slow your app down by needing to run it multiple times.
A reactive expression can be created by wrapping lines of code in a call to reactive(). To see this
in action the following lines in the example app:
# Directly link inputs and outputs
output$distPlot <- renderPlot({
    x    <- faithful[, 2]
    bins <- seq(min(x), max(x), length.out = input$bins + 1)

    hist(x, breaks = bins, col = 'darkgray', border = 'white')
})
could have been rewritten as:
# Create a reactive intermediate
reactive_bins <- reactive({
    bins <- seq(min(x), max(x), length.out = input$bins + 1)

    bins
})

# Use the reactive intermediate
output$distPlot <- renderPlot({
    x    <- faithful[, 2]

    hist(x, breaks = reactive_bins(), col = 'darkgray', border = 'white')
})
Three points to note in the above example
- The intermediate object is not an input or output, so is just saved as a normal variable name.
- Code running in a
reactive()function is in a reactive environment so can access input values likeinput$bins - The intermediate object
reactive_binscan be thought of a little like a function, we need to call it to see it’s value. So in the plotting code, this value is referred to asreactive_bins().
The dependency structure of this new code is that input$bins is a dependency of reactive bins,
which is a dependency of output$distPlot. So when the input slider is moved, the value of input$bins
changes, which changes the value of reactive_bins(), which changes the histogram.
When to use intermediates
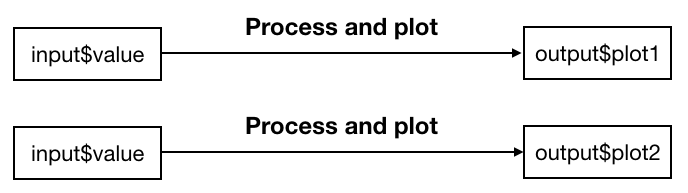
One common reason you might need to use a reactive intermediate is if you have some data processing steps and are then creating multiple plots from the processed data. Rather than running the processing steps separately for each plot, you might create a reactive intermediate containing the processed data, then produce plots from that intermediate.
Visually, we are trying to turn a situation like this:
 into something like this:
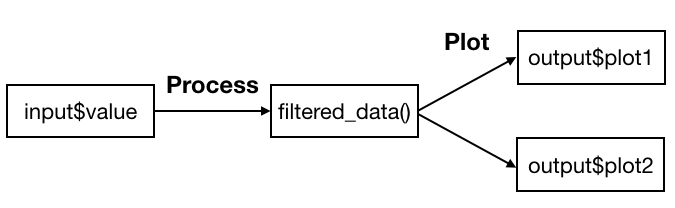
Because the code inside the call to reactive() is in a reactive environment, it can access input
values from the input object and can be called within render____() functions (or other reactive())
functions to have multiple linked intermediate values.
Two things at once
Create a second plot in your app above that shows population by lifeExp for the selected year.
Extract out the shared filtering step from each plot into a single reactive expression using
reactive()Use the intermediate filtered dataset in your plotting code instead. Don’t forget to add
()to the reactive variable you have created when you want to access it’s value.
Organising an app
You might be starting to feel like your current app.R file is getting a bit large, even though we
have only created a small app. Rather than keeping everything in a single file it is possible to separate
the UI and the server code into two separate files. These files must be in the same folder as each other
and be named ui.R and server.R.
Single file:
library(shiny)

ui <- fluidPage(
    titlePanel("Old Faithful Geyser Data"),

    sidebarLayout(
        sidebarPanel(
            sliderInput("bins",
                        "Number of bins:",
                        min = 1,
                        max = 50,
                        value = 30)
        ),

        mainPanel(
           plotOutput("distPlot")
        )
    )
)

server <- function(input, output) {

    output$distPlot <- renderPlot({
        x    <- faithful[, 2]
        bins <- seq(min(x), max(x), length.out = input$bins + 1)

        hist(x, breaks = bins, col = 'darkgray', border = 'white')
    })
}

shinyApp(ui = ui, server = server)
Two files
ui.R
library(shiny)

ui <- fluidPage(
    titlePanel("Old Faithful Geyser Data"),

    sidebarLayout(
        sidebarPanel(
            sliderInput("bins",
                        "Number of bins:",
                        min = 1,
                        max = 50,
                        value = 30)
        ),

        mainPanel(
           plotOutput("distPlot")
        )
    )
)
server.R
library(shiny)

server <- function(input, output) {

    output$distPlot <- renderPlot({
        x    <- faithful[, 2]
        bins <- seq(min(x), max(x), length.out = input$bins + 1)

        hist(x, breaks = bins, col = 'darkgray', border = 'white')
    })
}
The ui and server objects must be the final things created in these files, so if you have any
additional code (eg. loading datasets) it must be placed at the top of the file.
Key Points
Reactive elements update when their inputs change
Reactive elements can interact with non-reactive elements, but not the other way around
Interactive applications can be broken up into ‘UI’ and ‘server’ components